The numbers don't lie. Do you know what yours are saying?
Every lead, every project, every client, every team member - Zippix captures it all and turns it into a reporting layer that gives leadership the clarity to make decisions that actually move the firm forward.
Schedule a Demo
Modules Tracked
6 modules
Clients, Leads, Projects, Teams, Campaigns, Analytics all feeding one report
Views Available
3 views
Summary, Board, and List every angle of your firm's performance
Decisions Waiting
0 decisions waiting
Because Zippix surfaces the insight before you need to go looking for it
Report Refresh
Live
No scheduled exports. No stale data. Everything updates in real time
Every reporting need. Already built in.

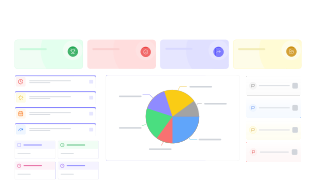
Summary View
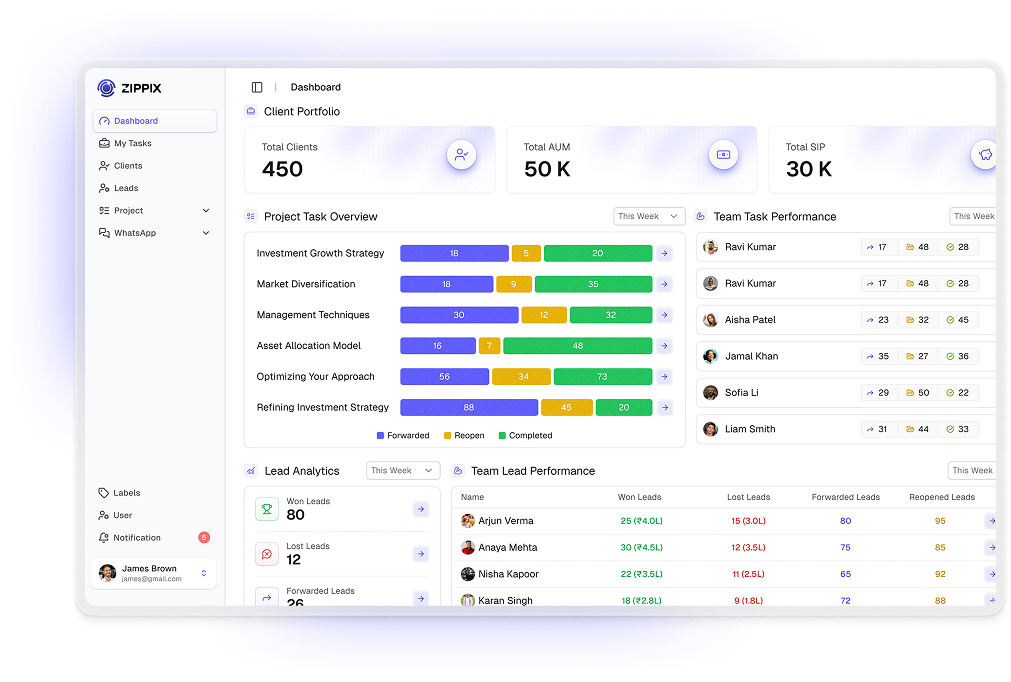
The executive layer. KPIs, team metrics, pipeline health, workload distribution, and overdue alerts - all on one screen. Built for the people who need the answer fast, not the full story.

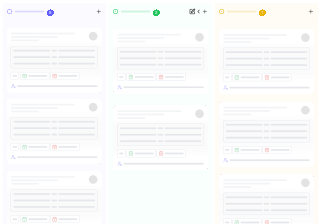
Board View
The operational layer. See every project, every lead, every task - live, by stage, by team. The reporting view for managers who need to understand what's moving and what's stuck.

List View
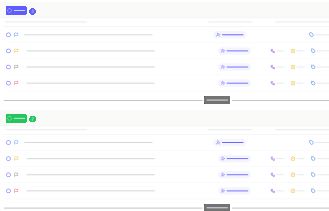
The analytical layer. Group, sort, and filter by status, priority, assignee, or date. The reporting view for people who need to interrogate the data, not just glance at it.
Client Portfolio
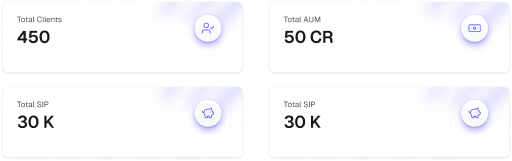
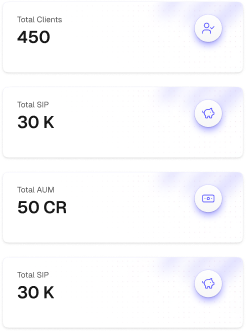
Total clients, AUM, and SIP values — tracked at the firm level and at the individual advisor level. Always current. Never compiled manually.
Lead Performance
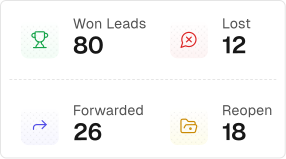
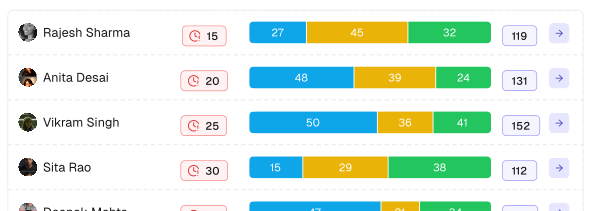
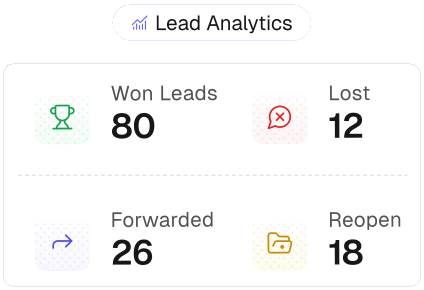
Won, Lost, Forwarded, and Reopened leads — broken down by team member, by time period, and by pipeline stage. Know exactly where your firm's growth is coming from.
Project & Task Delivery
Task completion rates, overdue counts, forwarded and reopened tasks per project, per person, per priority level. Delivery visibility that removes surprises.
Team Performance
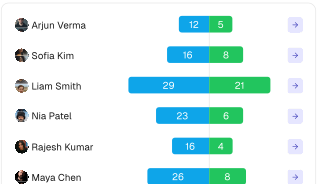
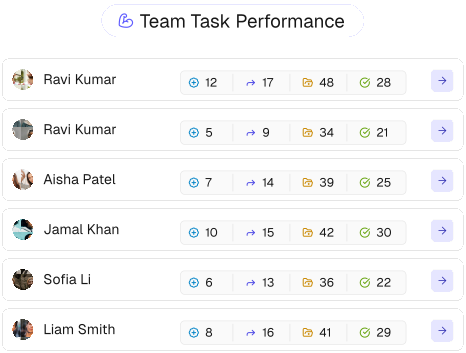
Side-by-side comparison of every team member's activity tasks completed, leads won, workload carried. Objective performance data that informs decisions, not just reviews.
Workload & Capacity
Who is carrying too much. Who has capacity. Where new work should go before it gets assigned to the wrong person. Proactive resourcing, not reactive firefighting.
Due & Overdue Intelligence
Overdue, Pending, This Week, Future, and No Due Date across every module. The one view that tells leadership where the firm's most urgent attention is needed right now.
Your report. Your lens. Your answer.
Generic reports show everyone the same thing. Zippix shows you exactly what you need to see - because every view is filterable across every dimension that matters. Time period, team member, status, priority, project, due date - layer filters until the data answers the specific question you're asking.
Your pipeline tells a story. Are you reading it?
Win rates. Lost patterns. Forwarded leads that keep cycling. The leads your top performer closes versus the ones that stall. Zippix's Lead Analytics section doesn't just count outcomes - it reveals the patterns inside them.
The firms that grow fastest... aren't the ones working hardest. They're the ones who know their numbers. Who see performance before it peaks.
And who use Zippix to make every decision count.